When Are Games Won?
Today I will take a look at when games are won. That is to ask if it is more likely that the winner of a game will gain a lead and then defend it until the end of the game or that the game is fairly even in the beginning and then towards the end, the better player will step up and win the deciding rallies.
The trivial answer is of course that the game is won by winning the last rally. But here I will take at what percentage of previous rallies were won by the eventual winner of the game.
Methodology
The method I will use is fairly simple. I just take all the games for which the progression of scores is known. For simplicity I will only include matches that were played in the current default scoring system of three games to 21.
Then I will group the games by their final scores. Or to be more concrete, by the number of points the loser achieved. In the current scoring system this is equivalent as the winners score can then by computed to be either 30 points, two points more than the loser or 21 points.
Then for each final score I will number the rallies and then count how many of the rallies with the same ordinal number were won by the eventual winner of the game. I can also calculate the expected percentage of rallies won by the game winner by dividing the winners score by the number of rallies. Here however the last rally, or the two last rallies in the case of games with extra points except 30-29, have to be omitted as these rallies are necessarily won by the winner. So the expected percentage of won rallies is thus for example for games ending 21-18
\[p_{expected} = \frac{21-1}{21+18-1} = \frac{20}{38} \approx 52.6\%\]For all games that finished after extra points, the expected probability will be \(p=50\%\).
Assuming that the number of rallies won is following a binomial distribution we can calculate the number of standard deviations between the expected number of won rallies and the observed number of won rallies. The error in the percentage can then be estimated to be
\[\sigma = \sqrt{ \frac{n_{Won} \cdot n_{Lost}}{(n_{Won} + n_{Lost})^3} }\]The difference can then be computed as
\[\Delta = \frac{P_{observed} - p_{expected}}{\sigma}\]So a positive value of \(\Delta\) indicates that this rally was won more often than expected by the winner of the game, a negative value indicates that this rally was won more seldom than expected. Due to the fluctuations due to pure chance, one would expect about 68% of the differences between -1 and 1, and about 95% between -2 and 2. Any deviation from the assumption of individually and identically distributed probabilities would lead to a more frequent observation of values away from zero. If these extreme values are clustered at parts of the game we could infer that these rallies do not have individually and identically probabilities. It would then need further explanation, why these rallies are more likely or less likely to be won by the winner of the game.
Results
These results were obtained using the matches from the database from 2008 until today. As stated above, only matches using the scoring system of three games to 21 and where the progession of scores was known were used.
Graphs
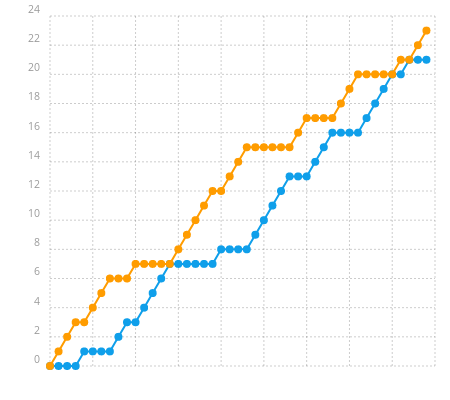
The following graph shows the probabilities for a rally to be won by the eventual winner of the game. The upper part shows that percentage as a bar chart, the horizontal line shows the expected percentage of won rallies for the rallies that were not necessarily won by the game winner. The lower plot shows the corresponding differences between the observed frequency and the expected frequency. Any clusters of positive or negative values is what would indicate rallies that are more likely or less likely to have been won by the game winner.
Initially the plot for games ending 21-17 is shown as this is the most common game score. You can switch to other scores using the buttons.
Browsing throught these plots we can observe several things:
- The last rally is always won by the winner of the game. This is obviously necessary to win the game.
- In games requiring extra points except 30-29, the last two points are won by the game winner. This is also necessary as you have to go from 20-20 to 22-20 for example.
- The latest point before the points necessary to win the game is less likely to be won by the winner of the game. It can be seen that in the lower plot, the rightmost bar is almost always very negative. Sometimes it can also be seen that the previous point before that point is more likely to be won by the game winner. This indicates that winning rallies alternates between the parties more often than would be expected.
- During the extra points the differences cancel pairwise after the 40th rally. That means that for example for a score of 26-24, the winner was less likely to win the 41st rally, but he was more likely to win the 42nd rally, as the game had to go through a score of 21-21, thus the differences of the 41st and the 42nd rally cancel. The same goes for the 43rd and 44th rally and so on.
- For a score of 21-0 (yes, these scores happen) the plot is rather trivial with all points being won by the winner of the game.
- In the rest of the games there are no visible patterns. That means the probabilities for winning the rally stays constant throughout the games.
Heatmap
We can also just plot the differences \(\Delta\) in a heatmap. This heatmap is shown below. Any clusters of blue (indicating fewer won rallies) or red (indicating more won rallies) would indicate a deviation from the i.i.d. assumption.
The game proceeds to go from left to right, the first rally is the leftmost, the latest rallies are the rightmost. Due to the different number of rallies in games, the heatmap is not a rectangle, but increases in size as one goes to the top. The upper rows correspond to longer games, the top-most row with an \(y\) value of 29 corresponds to the score of 30-29. The final rallies whose outcome is already determined by the score are not shown in the heatmap.
The lowest line corresponds to a score of 21-0 and thus all differences are zero, the line is thus completely white. In the heatmap one can confirm all the observations given above. The lower percentage of won rallies just prior to the final rally or rallies is visible as a blue border to the right. The cell just left to these blue cells is usually reddish, indicating that the preceeding rally was won more likely by the winner of the game. The section in the upper right corner is not as random as the rest of the map, this is due to the fact that pairs of rallies have to cancel each other out.
Most importantly, there are no visible clusters of blueish or reddish fields in the left or middle section of the map.
Conclusion
Asking whether games are more likely to be won in the beginning of the game or more likely to be won towards the end of the game, we can conclude that no parts of the game are more decisive. The distribution of differences is favouring an i.i.d.-assumption with the exception of the last one or two rallies before the rallies that are required to win the game. Here we see that winning a rally switches between the sides more often than one would expect. This can be explained by a disadvantage for the server. If serving is a disadvantage then it is more likely to convert a game point when the opponent has the serve, or put it differently, when the opponent has won the previous rally.
As this analysis is using all available matches, we cannot assess how the initial questions would be answered for individual players. Maybe some players are slow starters and win their games predominantly late in the game. Or some players might be fast starters who gain the lead early in the game and then win by just defending this. This is a question I will look further into in the future.